Writing a custom debug visualizer for Visual Studio 2015
20 Nov, 2016
Often at work I'll be debugging some incredibly complex logic with lists that can be hundreds, if not thousands, of items long. While the ability to inspect these lists using the normal debugging tools is useful, it gets annoying trying to scroll to the 700th item in a list and then accidentally moving the mouse focus away and having to start again.
For this reason I wanted to look into the possiblity of creating a custom display for certain objects while debugging in Visual Studio. For those of you who have worked with the DataTable you might be familiar with this screen:
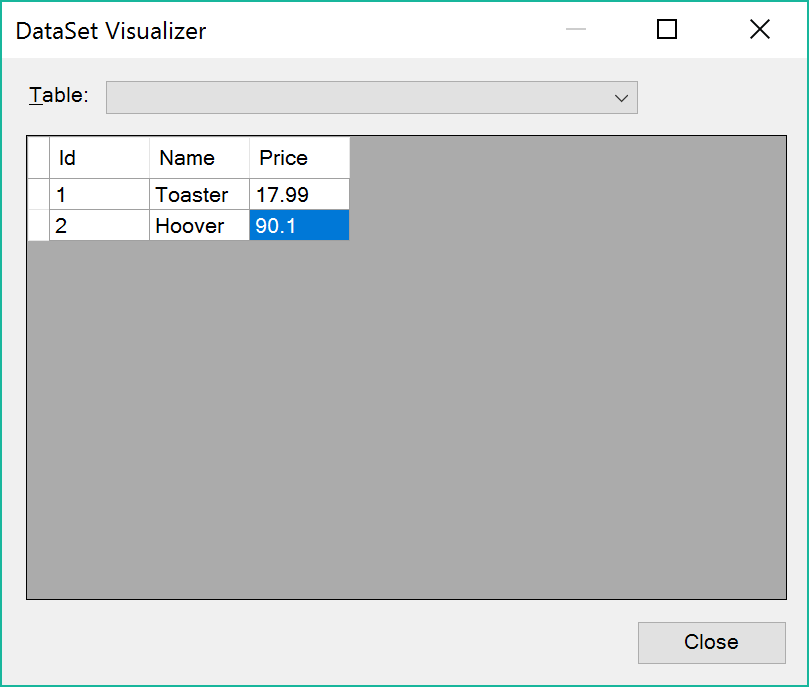
This can be accessed by hovering over the object when paused in the debugger and clicking the magnifying glass icon as shown here: