Attention Bubbles (Or Why Everything Happens So Much)

Like most side projects that devour hours of time and end up being entirely useless, this one started with a simple question:
Can recessions be predicted by increased interest in news stories about recessions?
The background behind this question -- and you'll have to forgive my complete ignorance of basically the entire field of economics -- is that recessions are a feature of capitalist economies. From what little I've read (and understood); during a boom, businesses scale up their operations to produce more and more "stuff". At a certain point the amount of "stuff" exceeds the demand for "stuff" and businesses and sectors are left holding a load of plant/equipment/employees they no longer need.
From this (probably wrong) summary of boom and bust it seems there's a certain extent to which recessions are based on people getting scared. When a consumer/business has lower confidence they're less likely to buy a new thing or make a plan for something, thereby reducing demand. This has a cascade effect throughout the market and causes a crash. It's basically a mass-panic. (I appreciate this description is probably making a lot of economists very angry, but I'll counter with my (tongue-in-cheek) belief that neither economics nor money are real, they're just belief systems.)
Given the mass-panic and social nature of recessions we should be able to spot the signs of a panic slightly before they happen. In the same way that you could tell that TikTok was going to be the next big thing -- yes this is probably going to date this article horribly by the end of the month -- by looking in the right places for increased interest in the app, signs of decreasing confidence should appear somewhat before the main event.
For this analysis I turned to what I affectionately call the "Orange Hell Site". Hacker News is a site for news stories across a wide range of topics, mainly focused on topics of interest to Silicon Valley; technology, economics, science and Venture Capitalist culture. Because of its Silicon Valley focus it tends to broadly reflect the beliefs of the elite in Silicon Valley; whether that's techno-utopian solutions to the climate crisis or the belief that someone with no qualifications working 2 minimum wage jobs can reach FIRE (Financial Independence Retire Early) just by applying themselves. This also means it takes a keen interest in all things financial markets, stocks, shares and whatever-the-hell RSUs are.
TLDR: by looking at what people with a lot of involvement and interest in the stock market are talking about we're going to see if recessions might have signals preceding them.
One of the main problems with this approach is that fortunately for everyone but unfortunately for the analysis, recessions don't happen often. The last Big One was 2007/8, it seems likely we're due another one anytime soon, but by their very nature that's impossible to predict. Hacker News launched in February of 2007, just before the last recession so we have a very limited set of data to look at.
Building It
The first problem I encountered was the nature of the Hacker News API. While it was extremely useful to have any API, the design of the API requires enumerating every single story, comment, job posting and Ask HN by ID just to find the stories.
I excluded comments from the analysis since they didn't really seem relevant. I was more interested in the higher-threshold activity of submissions since I felt they would more accurately reflect what was being seen by people.
At the time the question came to mind I was observing what I believed to be a bubble in stories about recessions (August 2019). In order to validate the approach without enumerating all 22 million items (and flooding the API with requests) I initially downloaded the data with IDs from about 16 million to about 20 million (2017 - 2019).
The initial dataset was, frankly, useless:
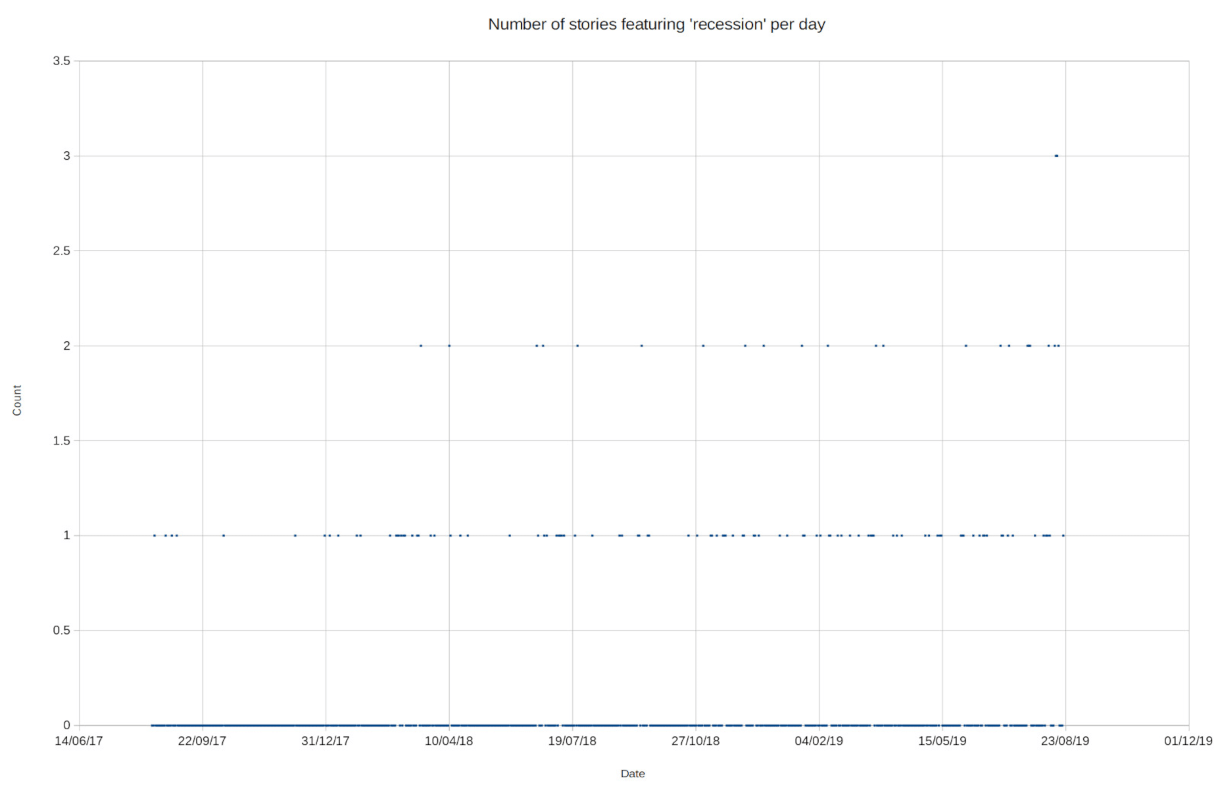
It did appear to show something like an increase in frequency of stories about recession though. I just needed a lot more data.
This resulted in the need to enumerate the other 16 million entries from 0 - 16,000,000 as well as the new entries from 20 million - 22 million. The crawler I used for the first data-set was very slow. It was using a single thread and a delay between requesting each item (in an attempt to be a good citizen/API consumer) it had taken weeks of running the crawler overnight just to fill the initial 4 million set.
Since I was running everything on my laptop and didn't want to pay anything to solve what was ultimately a stupid question, any solution was constrained by the lack of disk space, CPU and memory on my fairly cruddy laptop.
The crawler went through many iterations before reaching its final form. The final crawler is a C# .NET Core console application which uses a configurable number of threads and writes its data to a SQLite backing store. This SQLite database is shared by all applications/ Initially I used my own binary format to reduce file-size but this wasn't very useful when it came to running the crawler and querying the data from a web application.
I also needed a way to view the data. There's probably a way to analyse the data with statistical methods but at this point my motivation changed from building some kind of predictive model (nowhere near enough data) to building something to visually inspect whether any topic, not just recessions, was undergoing what I call an "attention bubble". To this end I build an ASP.NET Core website.
As it turned out, perhaps unsurprisingly, running a `WHERE title LIKE '%recession%" search on SQLite is very slow. This was a good opportunity to learn a new thing, so I added a Lucene.NET index to the mix for free text search. The indexer code is here, as it was my first time using Lucene.NET I think I probably missed a whole load of potential optimizations so it's still fairly slow, but much better than it was when using SQLite and probably acceptable.
The end result is hosted here. It provides search capabilities for terms in story titles in Hacker News postings. Due to the aforementioned "not wanting to spend money on a stupid question", it's piggybacking on this blog's VPS (which is the lowest tier possible machine) so will fall over above about 3 concurrent users, so go easy on it. It runs an update every hour to crawl new stories and index them using ASP.NET Core's
BackgroundService. This should probably be hived off to a separate service but having it in-process makes cache invalidation a lot easier, though there's no real drawback to serving stale data for something like this. Also if you hit the site after a cache invalidation it's going to be super-slow for the first request.
A disclaimer on the front-end code: I built the front-end as a means to an end (no pun intended). For this I used jQuery and didn't even bother retrieving the data from an API endpoint. Instead the data gets bundled up with the server HTML response. For this reason the front-end is a garbage fire.
Pretty Pictures
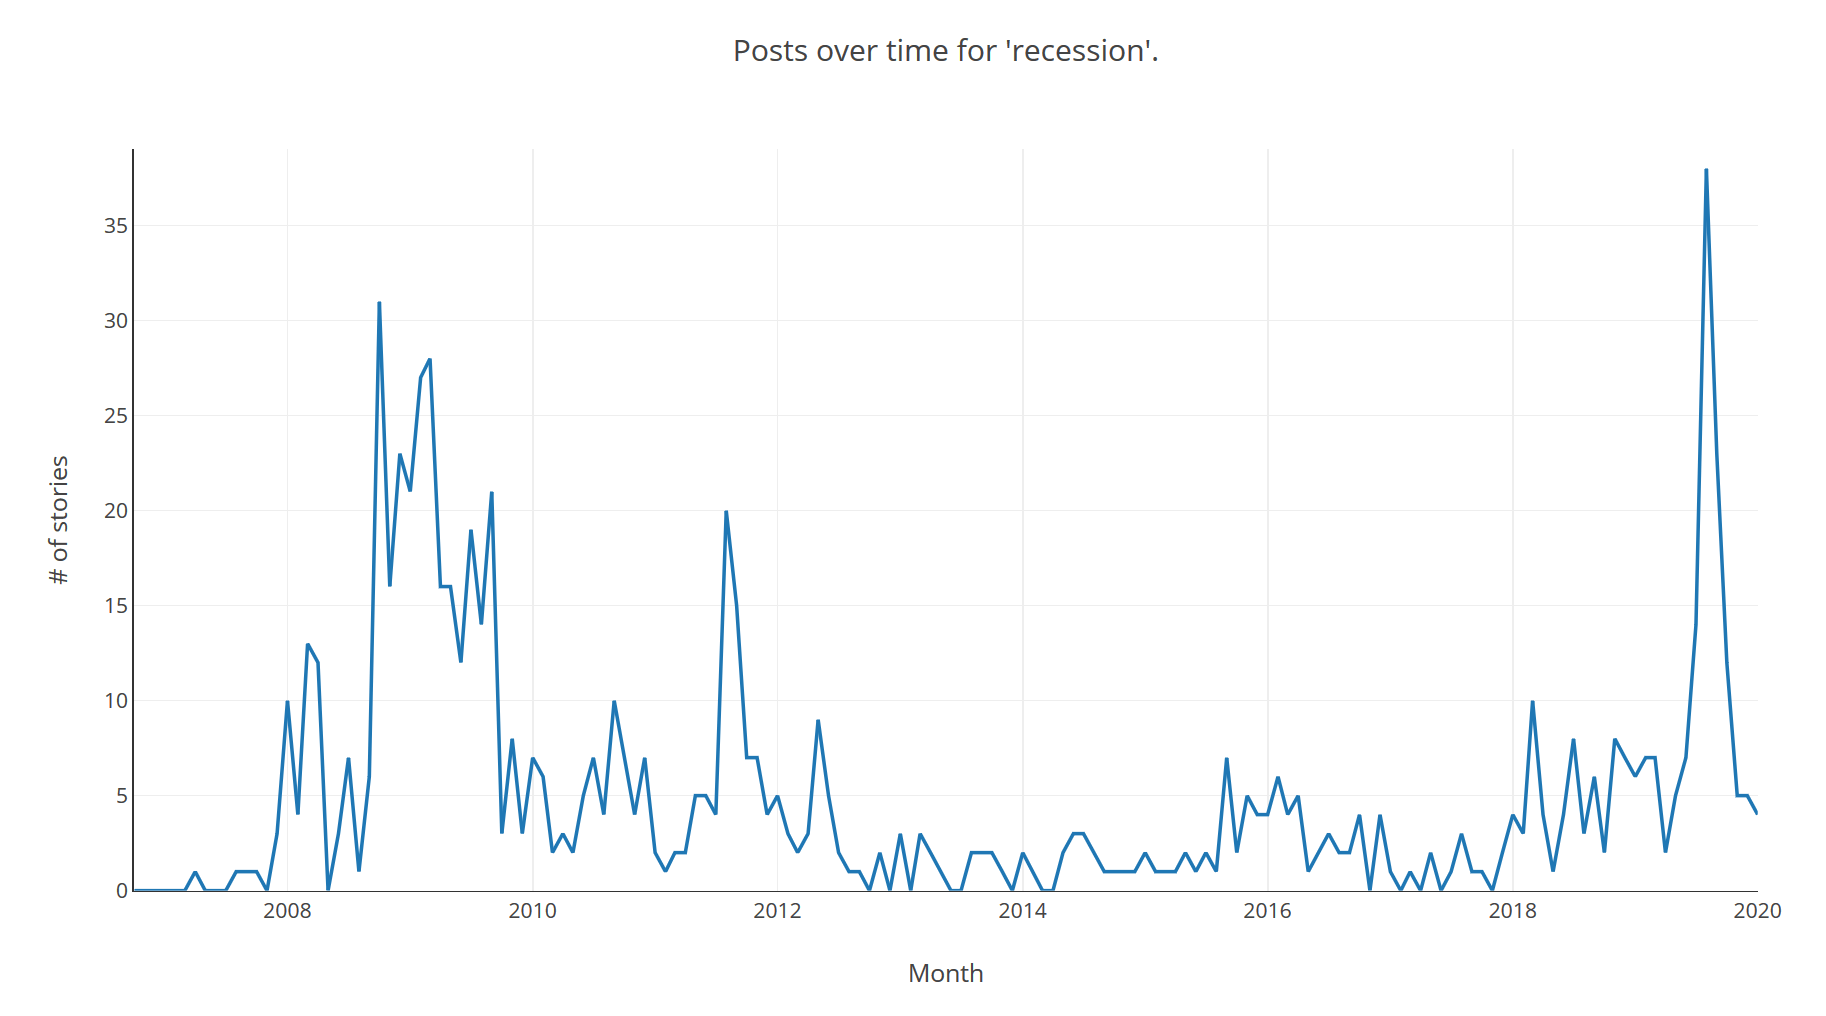
Enough talking, let's look at some of the data. First up, our (revised) initial question, was I observing an 'attention bubble' about recessions? This is the count of stories with "recession" in the title by month:
Since there are more posts per-day nowadays it's also useful to look at the count as a percentage of all posts in the period. This is the same data as a percentage of stories in the period rather than count:
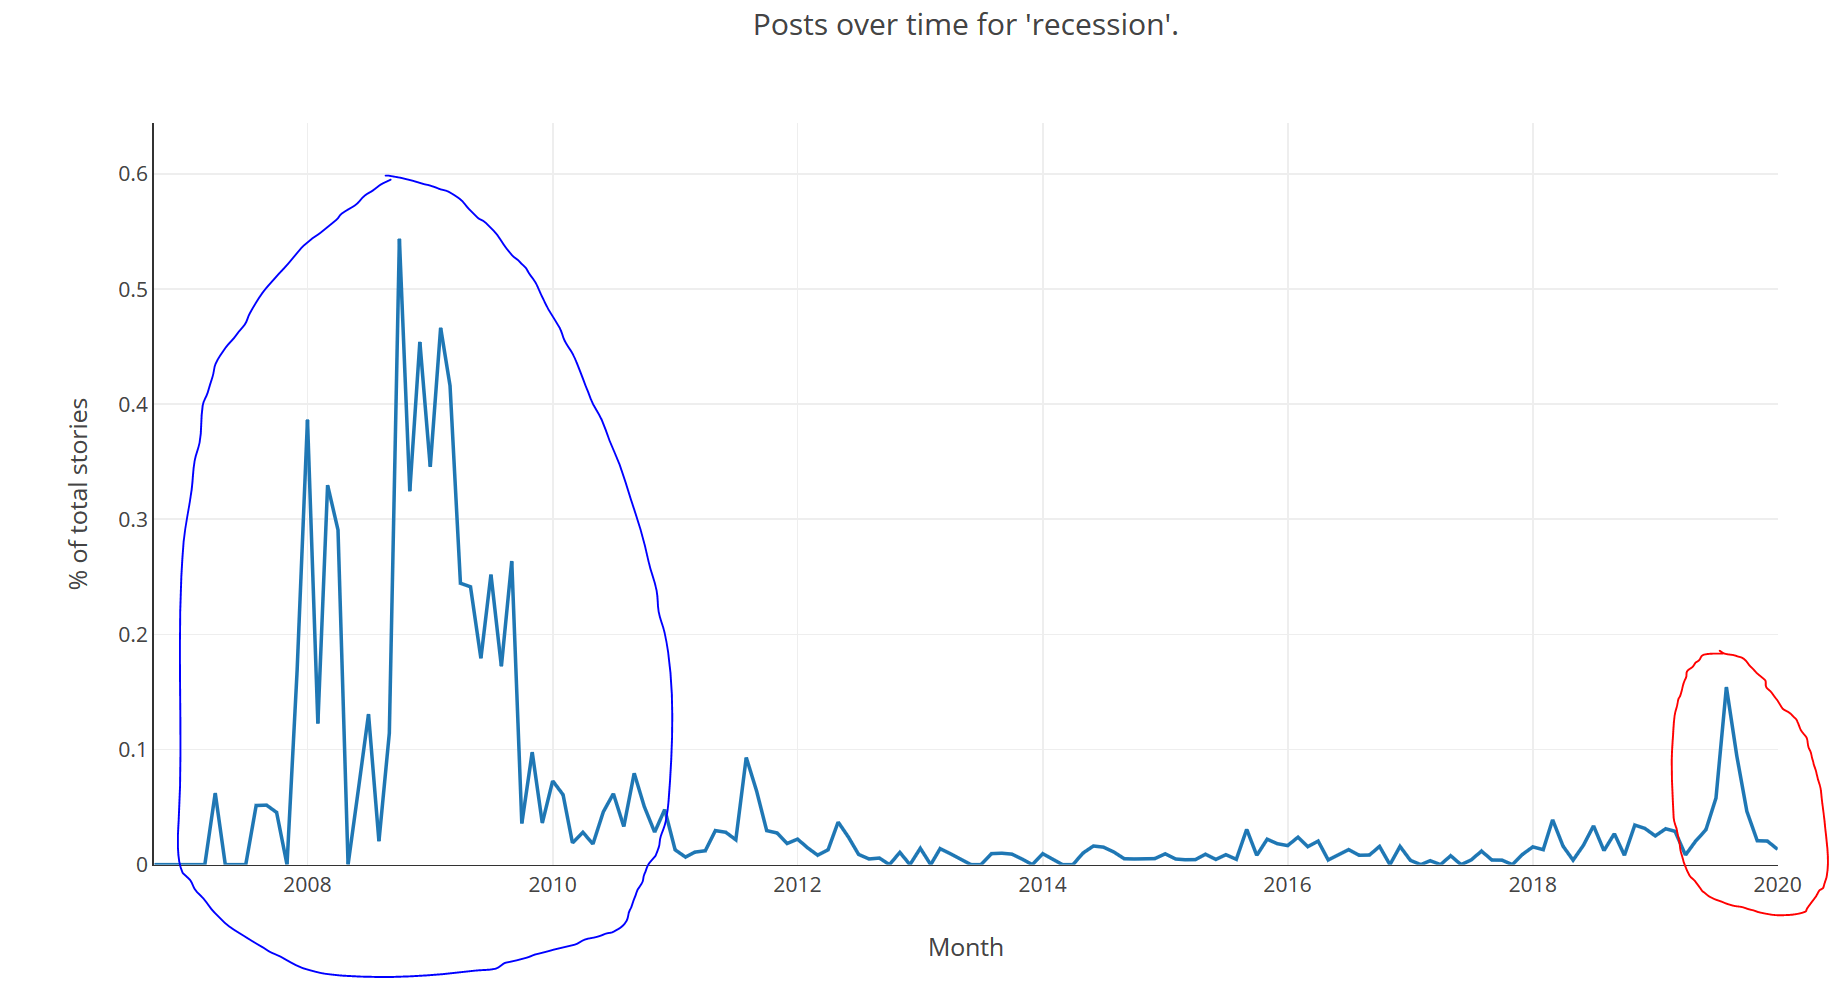
Circled in blue is the last "Big One", 2007/8 but it has a long tail into 2009/10. In red is the peak I was observing in Fall/Autumn of 2019. It seems to have fizzled out, perhaps QE is keeping the economy afloat for a few more months, but it will be interesting to see how it develops. There was definitely a spike but whether it represents a foreshock is unknowable.
An example of a pure attention bubble might be the "Cybertruck", Tesla's new electric truck announcement generated a lot of buzz, with people split between it being the worst vehicle ever designed or a design masterpiece:
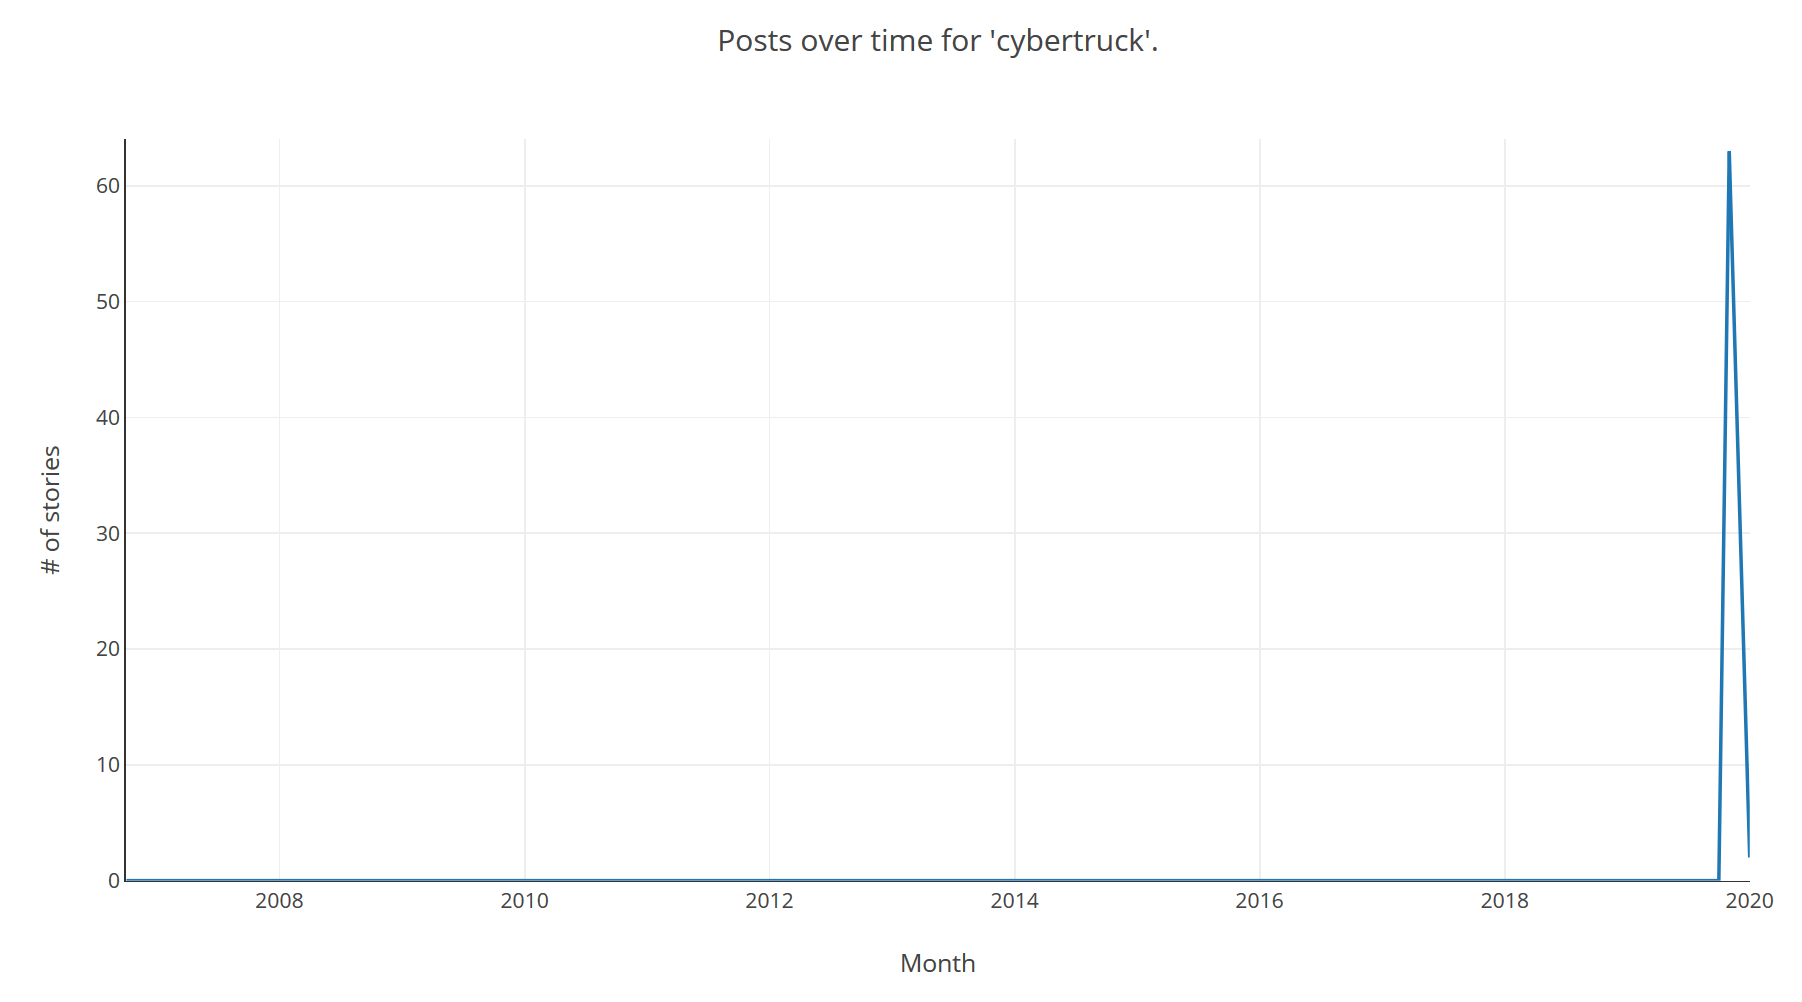
The big spike around the announcement seems to have fizzled out, again it will be interesting to see how it develops, if the Cybertruck is ever actually released.
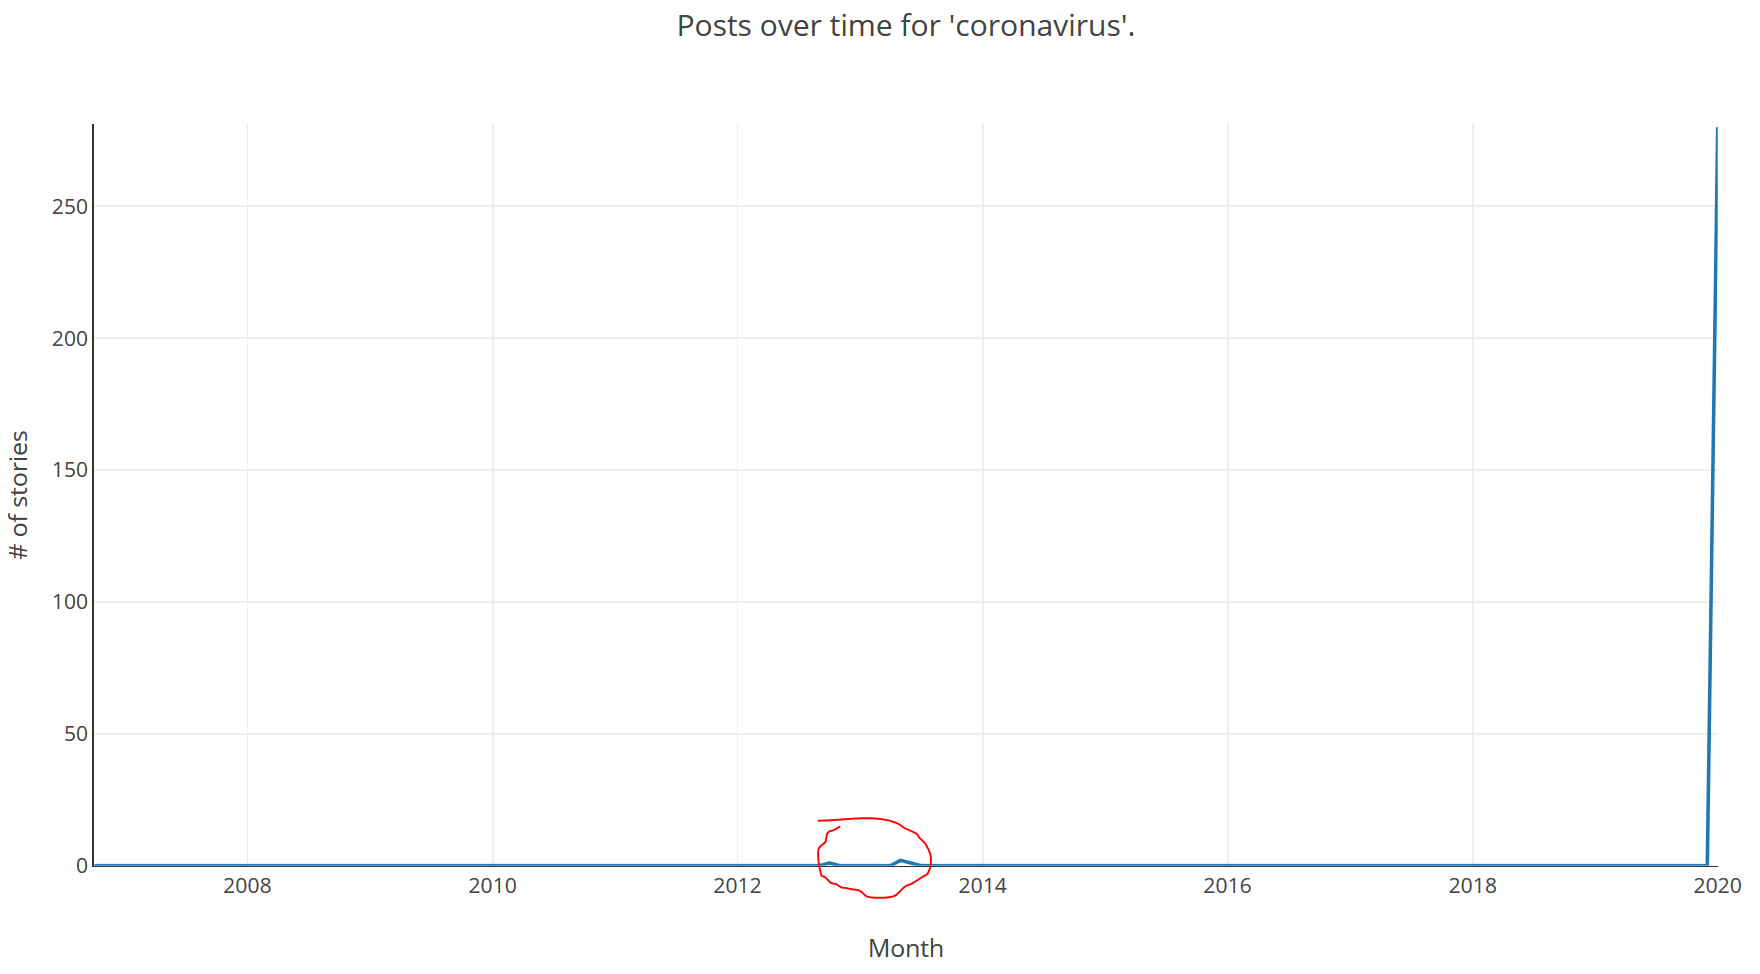
Another topic that is unfortunately in the news is the, as yet unnamed, coronavirus. The SARS crisis of 2003 was also a coronavirus which sadly killed quite a few people but was luckily contained, partly because people became symptomatic prior to being infectious; so people tended to have been contained prior to spreading the virus. (A great read on the topic of viruses including SARS as well as other zoonoses is Spillover by David Quammen). Hopefully this coronavirus will also be easily contained. Again we see a huge spike of interest in this topic at the right of the graph, which will hopefully fizzle out quickly. Also circled in red are the only mentions of coronavirus in submissions prior to 2020:
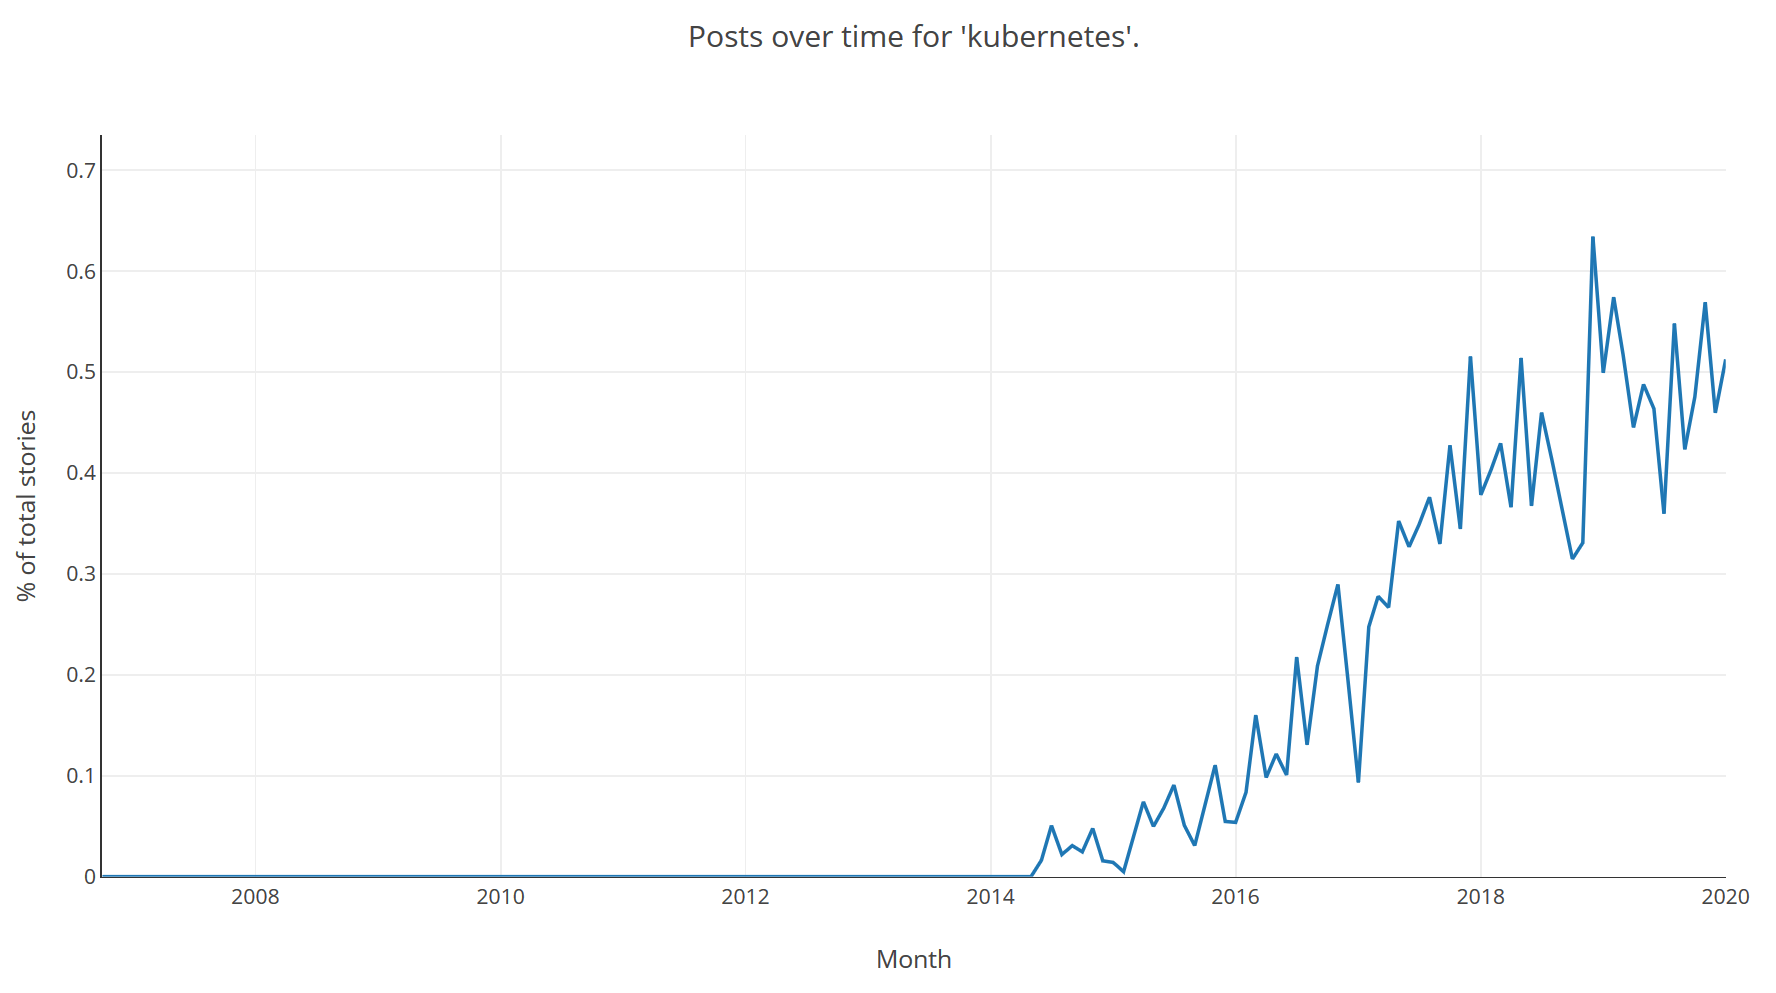
On a less sombre note we can also look at how named technologies are trending, and how they trend after launch, for example Kubernetes as a % by month:
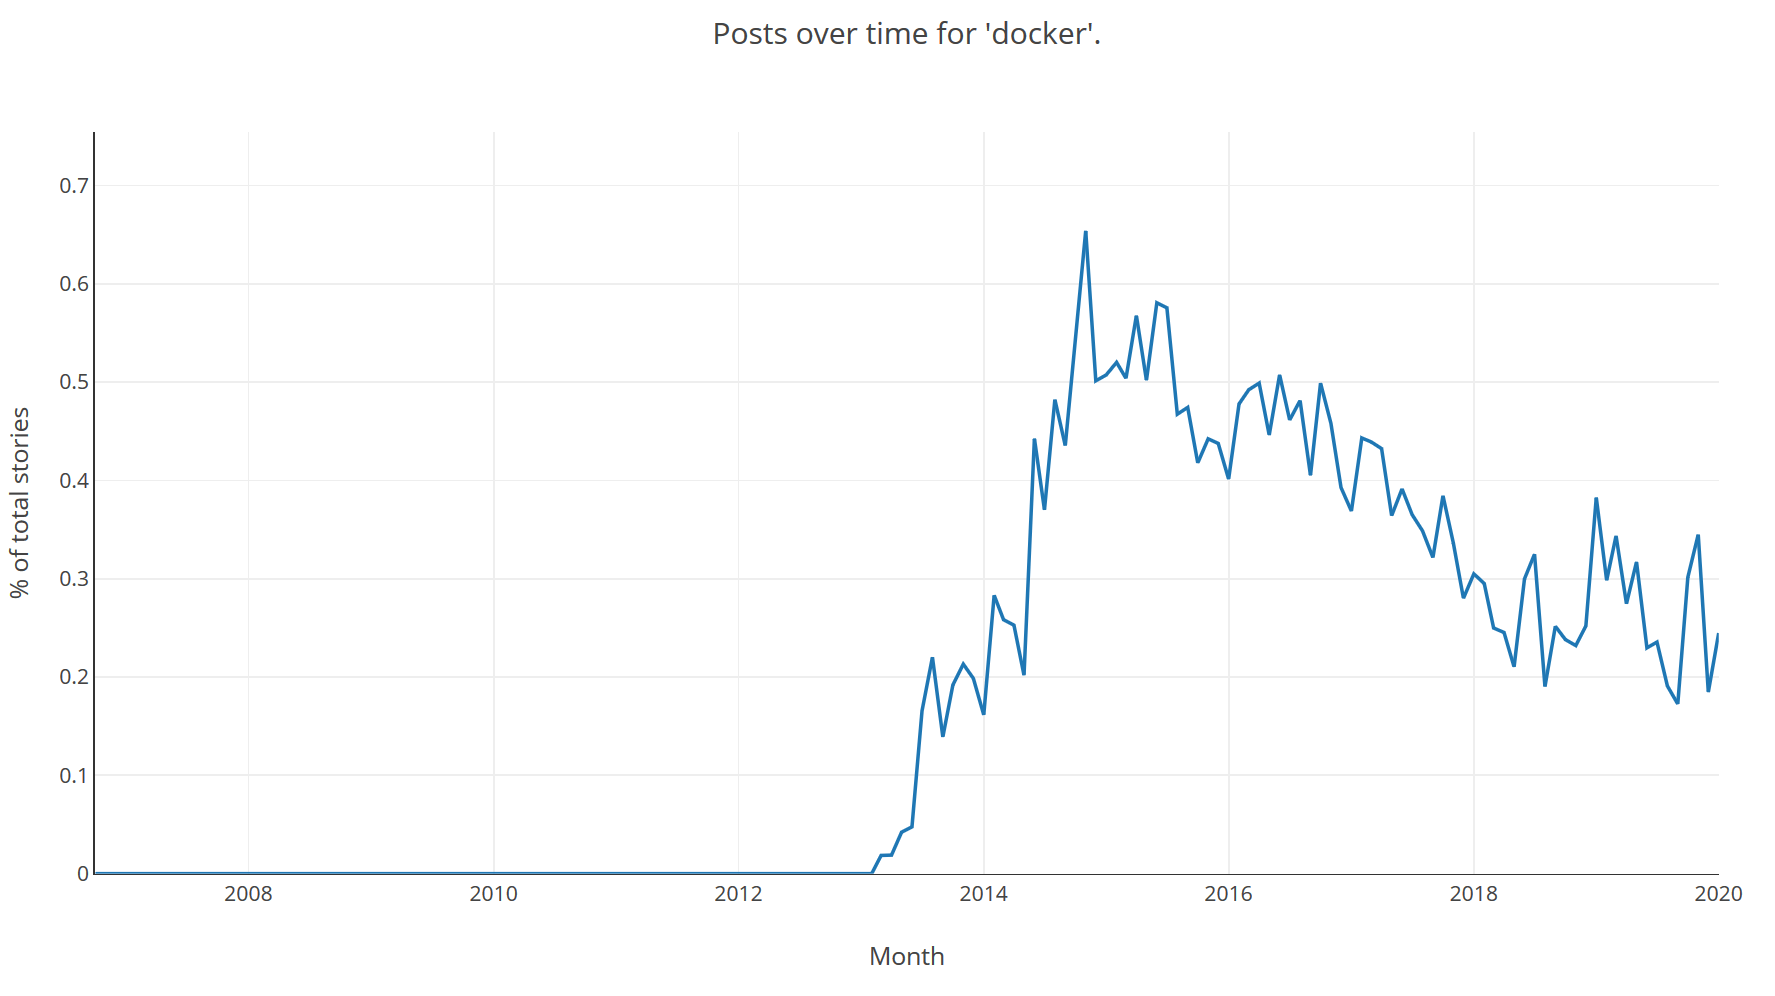
And the trend of another technology in the same field, Docker:
Next Steps
I don't really intend to do much more work on this project, the result serves its purpose and I've got PdfPig to keep me occupied. However some enhancements would be:
- Improve scoring of search terms in Lucene using boosting for certain fields.
- Improve performance. Other than putting it on a bigger machine it remains to be seen what the performance is like under high load. It's likely upgrading to .NET Core 3.0 from 2.1 would help here, there are a lot of performance improvements to the framework between these versions. It also seems like sharding the Lucene index might help but that's a lot of work for a side-project.
- Allow multiple trends on the same plot. It would be interesting to compare Kubernetes with Docker directly, or PyTorch with Tensorflow to get an idea of the relative trends in attention.
- Accounting for score received by the submission on Hacker News. This would probably be the most important metric to account for and in retrospect was the main thing I would have changed if I were starting building this now, storing a snapshot of the score -- perhaps after a lead time of several days -- would allow more interesting analysis of the popularity of the topics outside of a naive count.
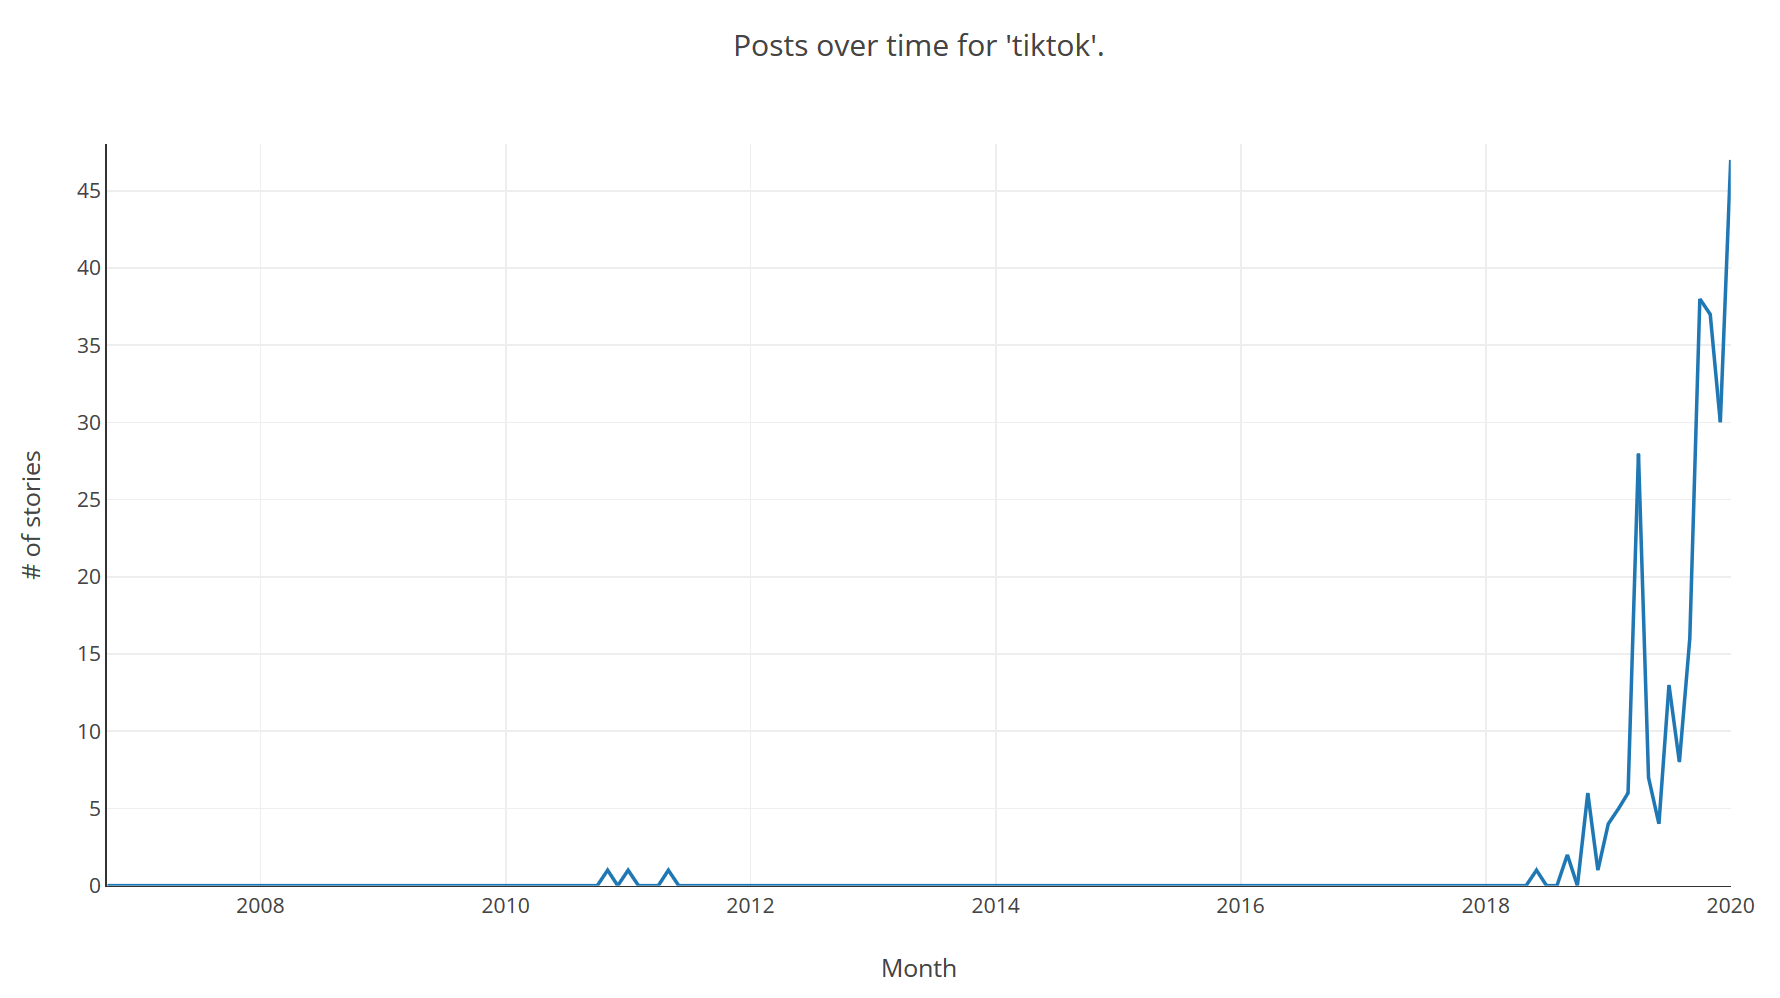
Bonus round, TikTok trend: