You sank my battleship

So this is probably one of those things that everyone else but me knows and I'm just going to reveal my ignorance, but as a note to myself for future and for those who don't know, here's how you remove the need for battleship debugging (scatter the code with breakpoints and hope you hit something) in Visual Studio.
This is the same as 'Pause On Exceptions' in a Javascript debugger such as that in Google Chrome and other debuggers, but if you are new to debugging and debuggers, it's not immediately obvious.
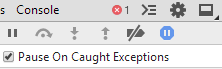
This means the code automatically breaks when any Exception is thrown and allows you to see the exact moment a problem occurs and the nature of the exception at this point.
How to enable
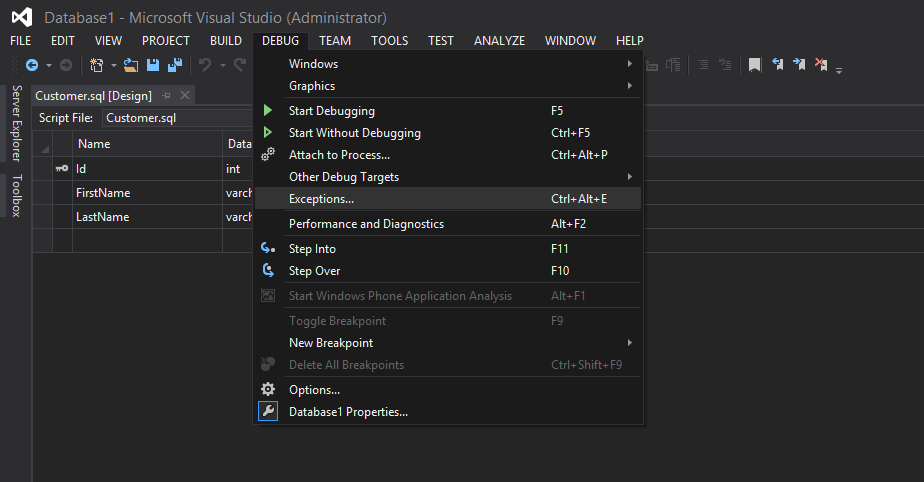
The following screenshots are from the VS2014 CTP however the steps are the same for most earlier versions, if you can't find the Exceptions window, try ctrl + d, ctrl + e (yes, it's Ctrl + Alt + E in the image but I don't think this is the case for pre-VS13 versions).
So first open the debug menu and find the 'Exceptions' option:
Then make sure Common Language Runtime Errors are set to 'Thrown':
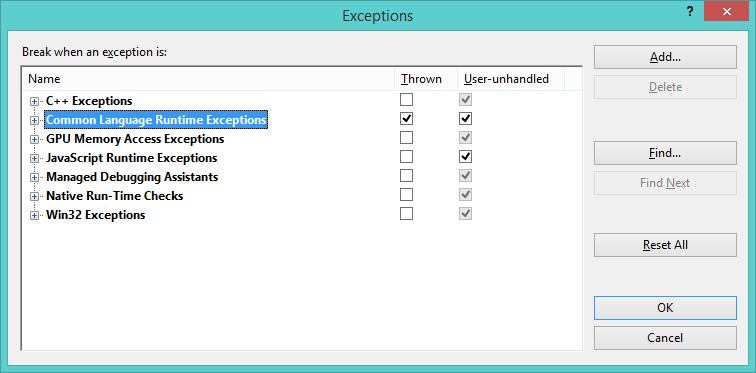
And that's it, no more guessing exactly where an error occurred based on a vague stack trace which may be obfuscated by poorly implemented error handling in the creaking old legacy application you're maintaining.